Security (SecOps)
7.1 Overview
MCM centralizes findings from cloud, containers, source code, and hosts. The SecOps dashboard provides an aggregated overview and workflows across all connected accounts, with separate tabs, dashboards, and overviews for:
-
Findings
-
Audit Log Security Scanning
-
Agents
-
Execution History
-
Settings
7.2 Supported Security Sources
| Cloud Security |
|---|
| AWS GuardDuty |
| Azure Defender |
| CloudTrail |
| Container Security |
|---|
| Docker Hub |
| ECR |
| GitHub Container Registry |
| Source Code Security |
|---|
| GitHub Repositories |
| Trivy SAST |
| Host Security |
|---|
| Ubuntu Hosts |
| Wazuh Agents |
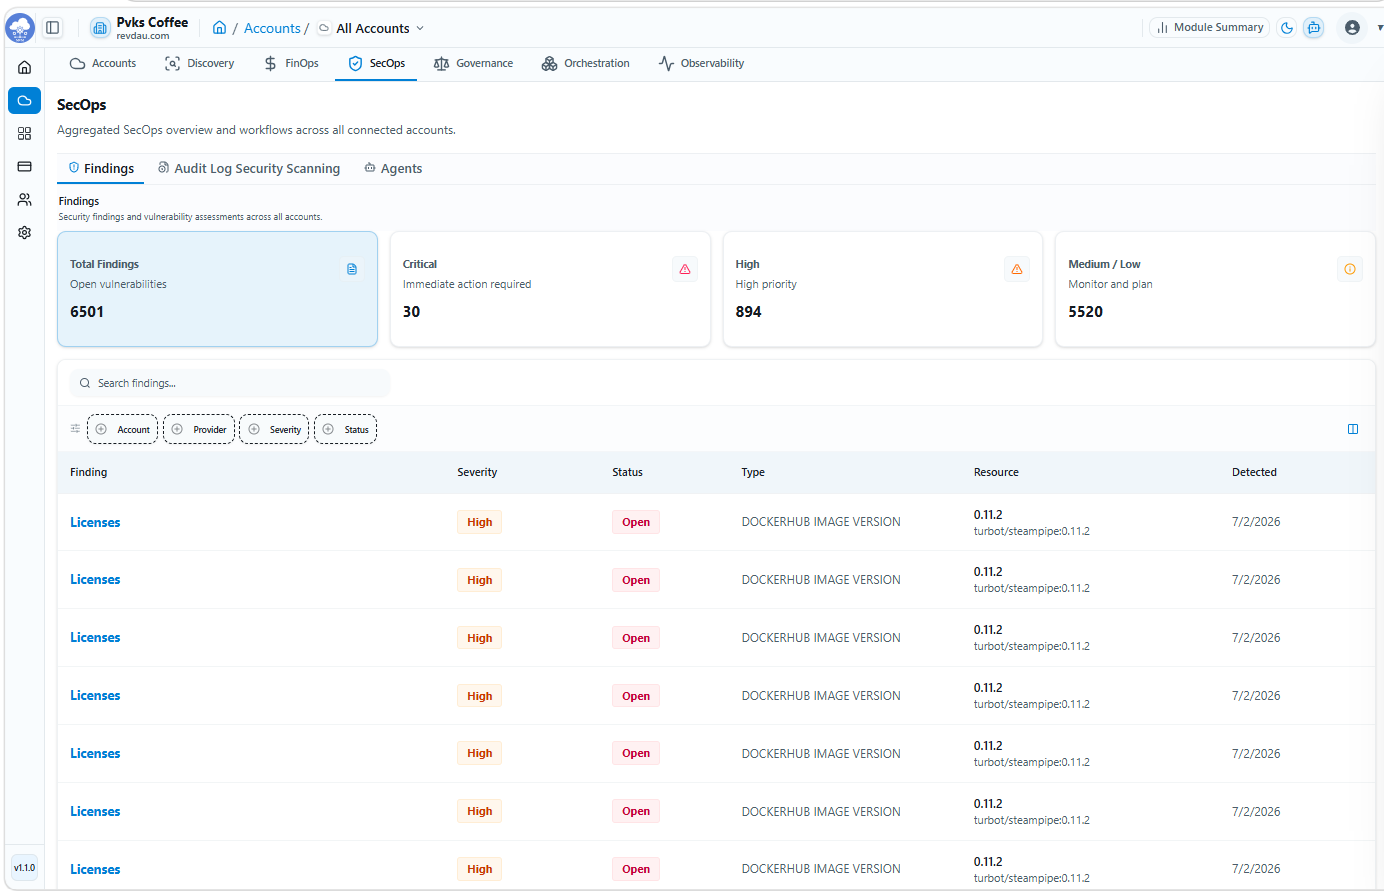
7.3 Security Dashboard
Unified visibility into security findings by severity:
-
Total Findings
-
Critical Findings
-
High Findings
-
Medium Findings
-
Low Findings
Finding statuses: Open, In Progress, Resolved.
7.4 Findings
View findings at the all-accounts level. Search and filter by Account, Provider, Severity, and Status. Table attributes include: Finding Name, Severity, Status, Type, Resource, and Detected Date.
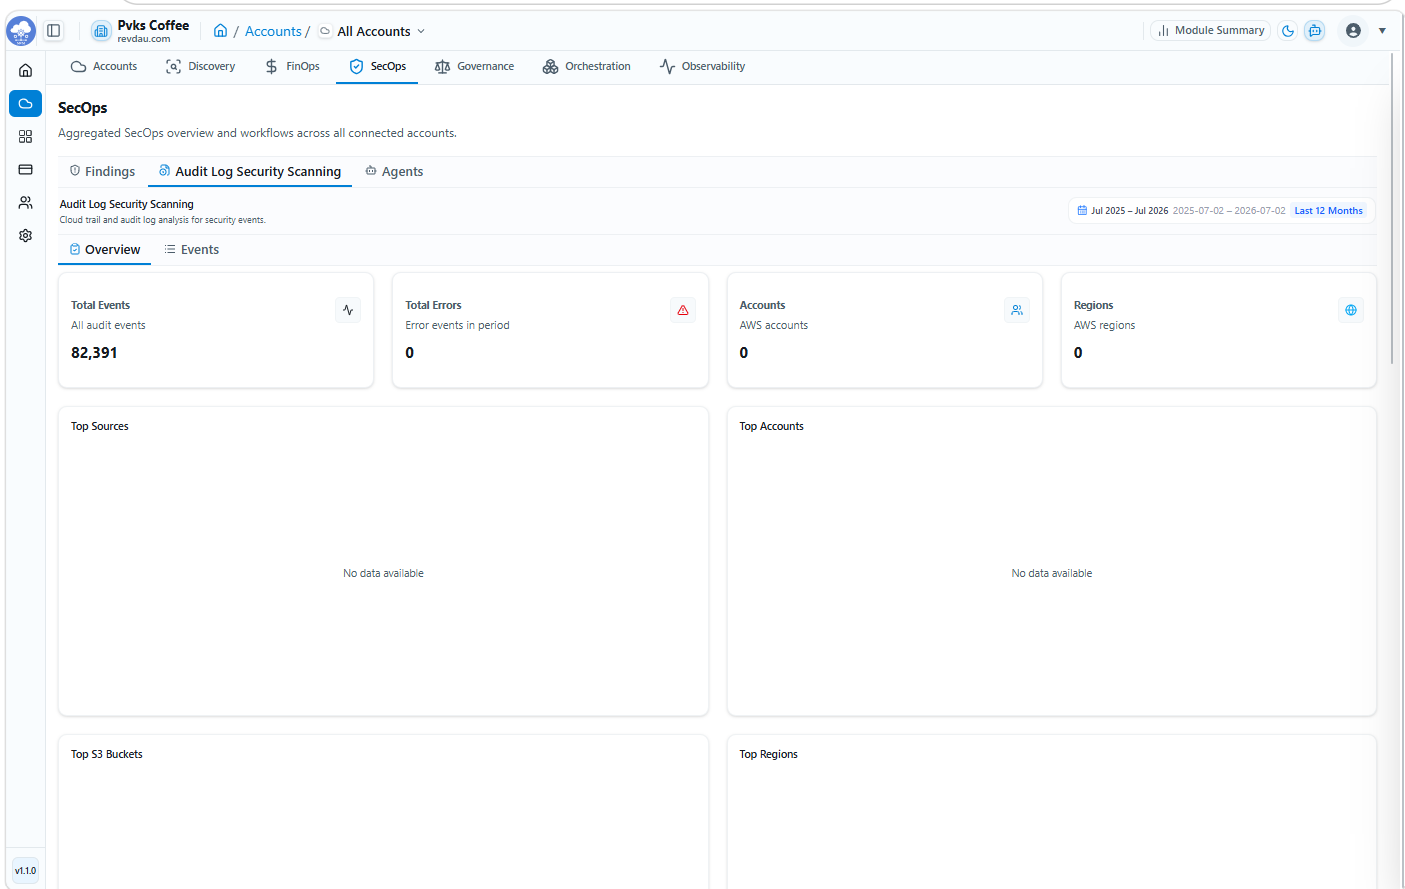
7.5 Audit Log Security Scanning
CloudTrail and audit log analysis for connected accounts.
7.5.1 Overview Tab
-
Total Events — All audit events
-
Total Errors — Error events in period
-
Accounts — AWS accounts
-
Regions — AWS regions
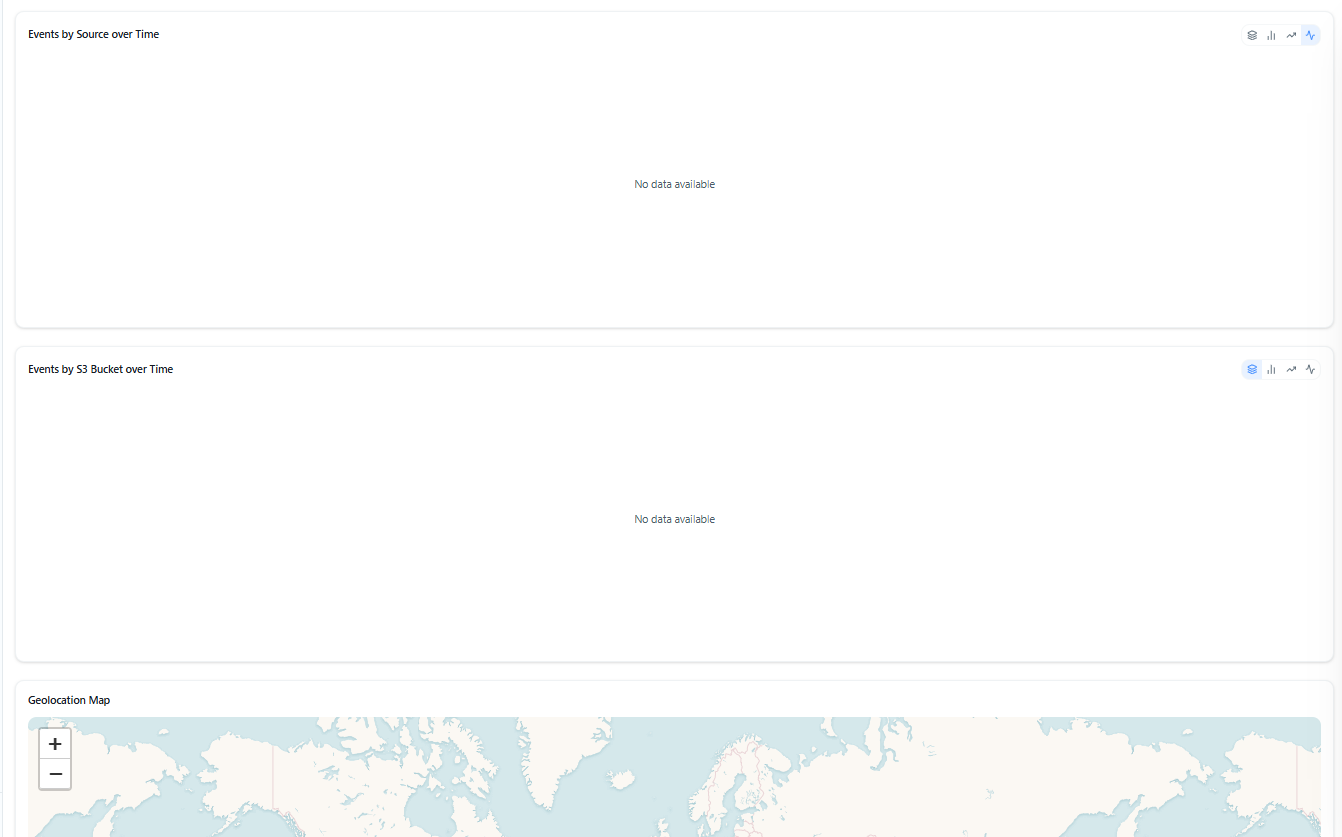
Additional dashboards: Top Sources, Top Accounts, Top S3 Buckets, Top Regions, Events by Source over Time, Events by S3 Bucket over Time, Geolocation Map.
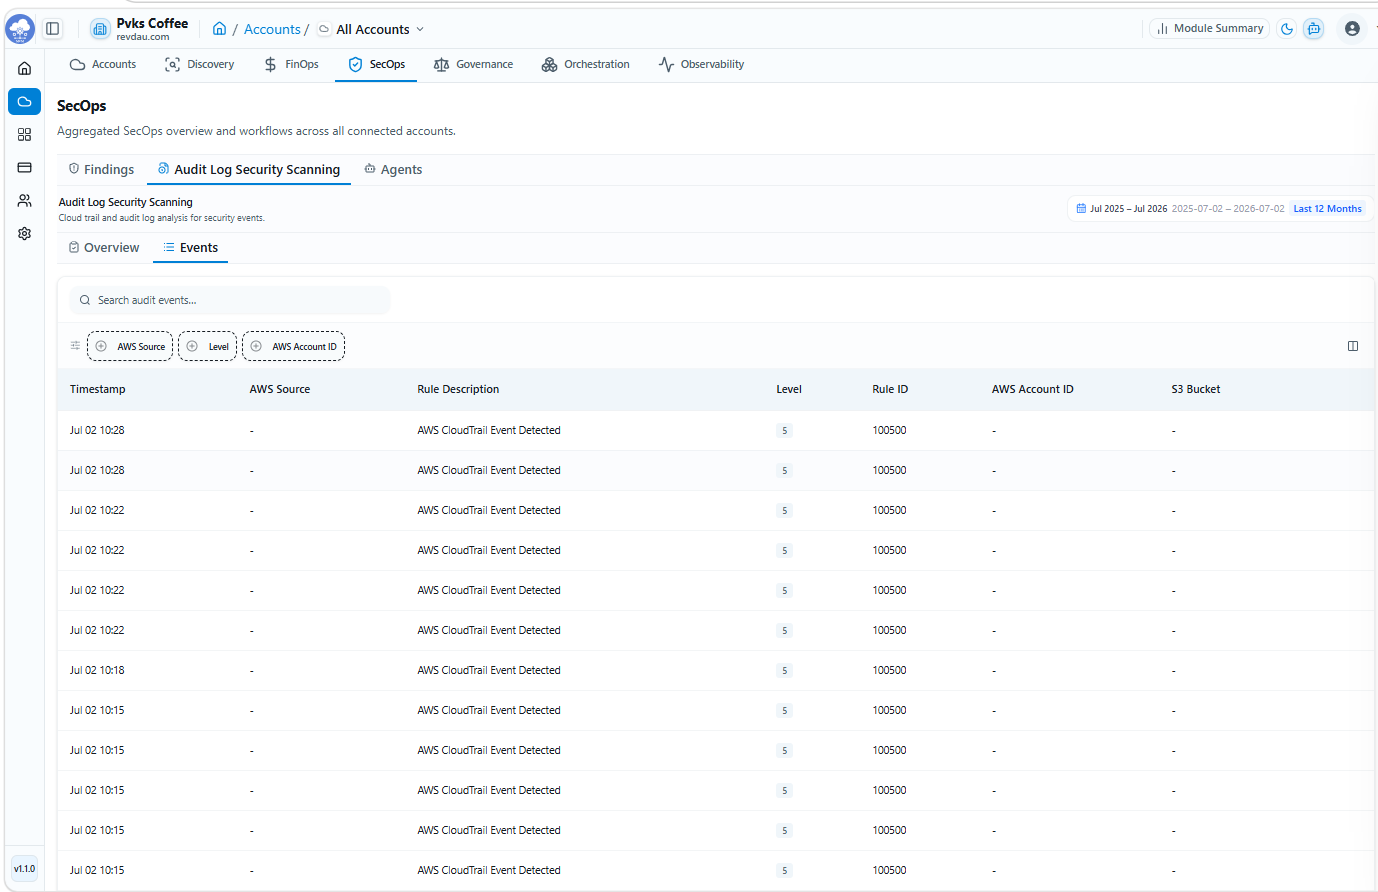
7.5.2 Events Tab
| Attribute | Description |
|---|---|
| Timestamp | Event date and time |
| AWS Source | Source service |
| Rule Description | Triggered rule description |
| Level | Severity level |
| Rule ID | Policy rule identifier |
| S3 Bucket | Associated S3 bucket |
Search and filter functionality is available:
-
AWS Source
-
Level
-
AWS Account ID
-
Date range filter
7.6 Agents
Security agent monitoring and threat detection. Agent dashboards include Overview and Events, with a dropdown to switch between monitoring modes:
-
Agent
-
Runtime Security
-
Network Security
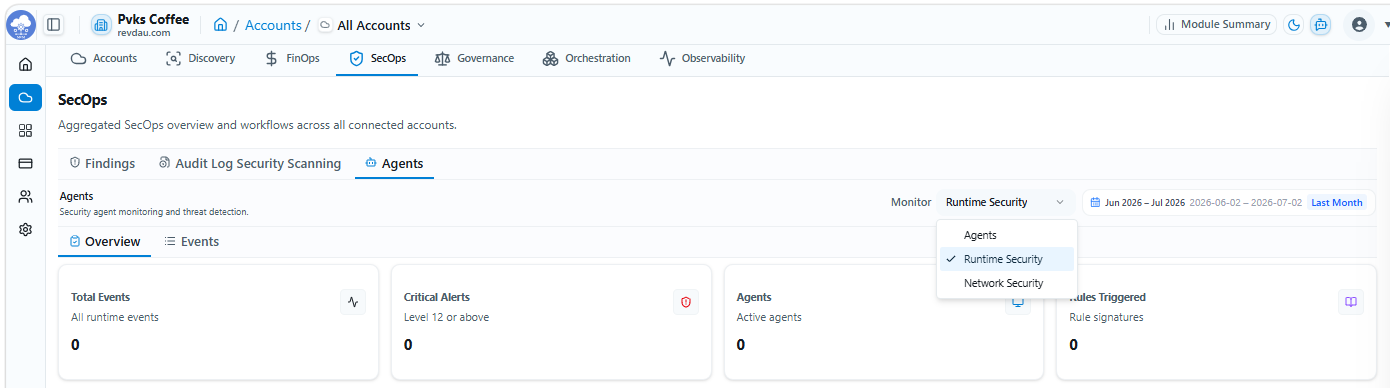
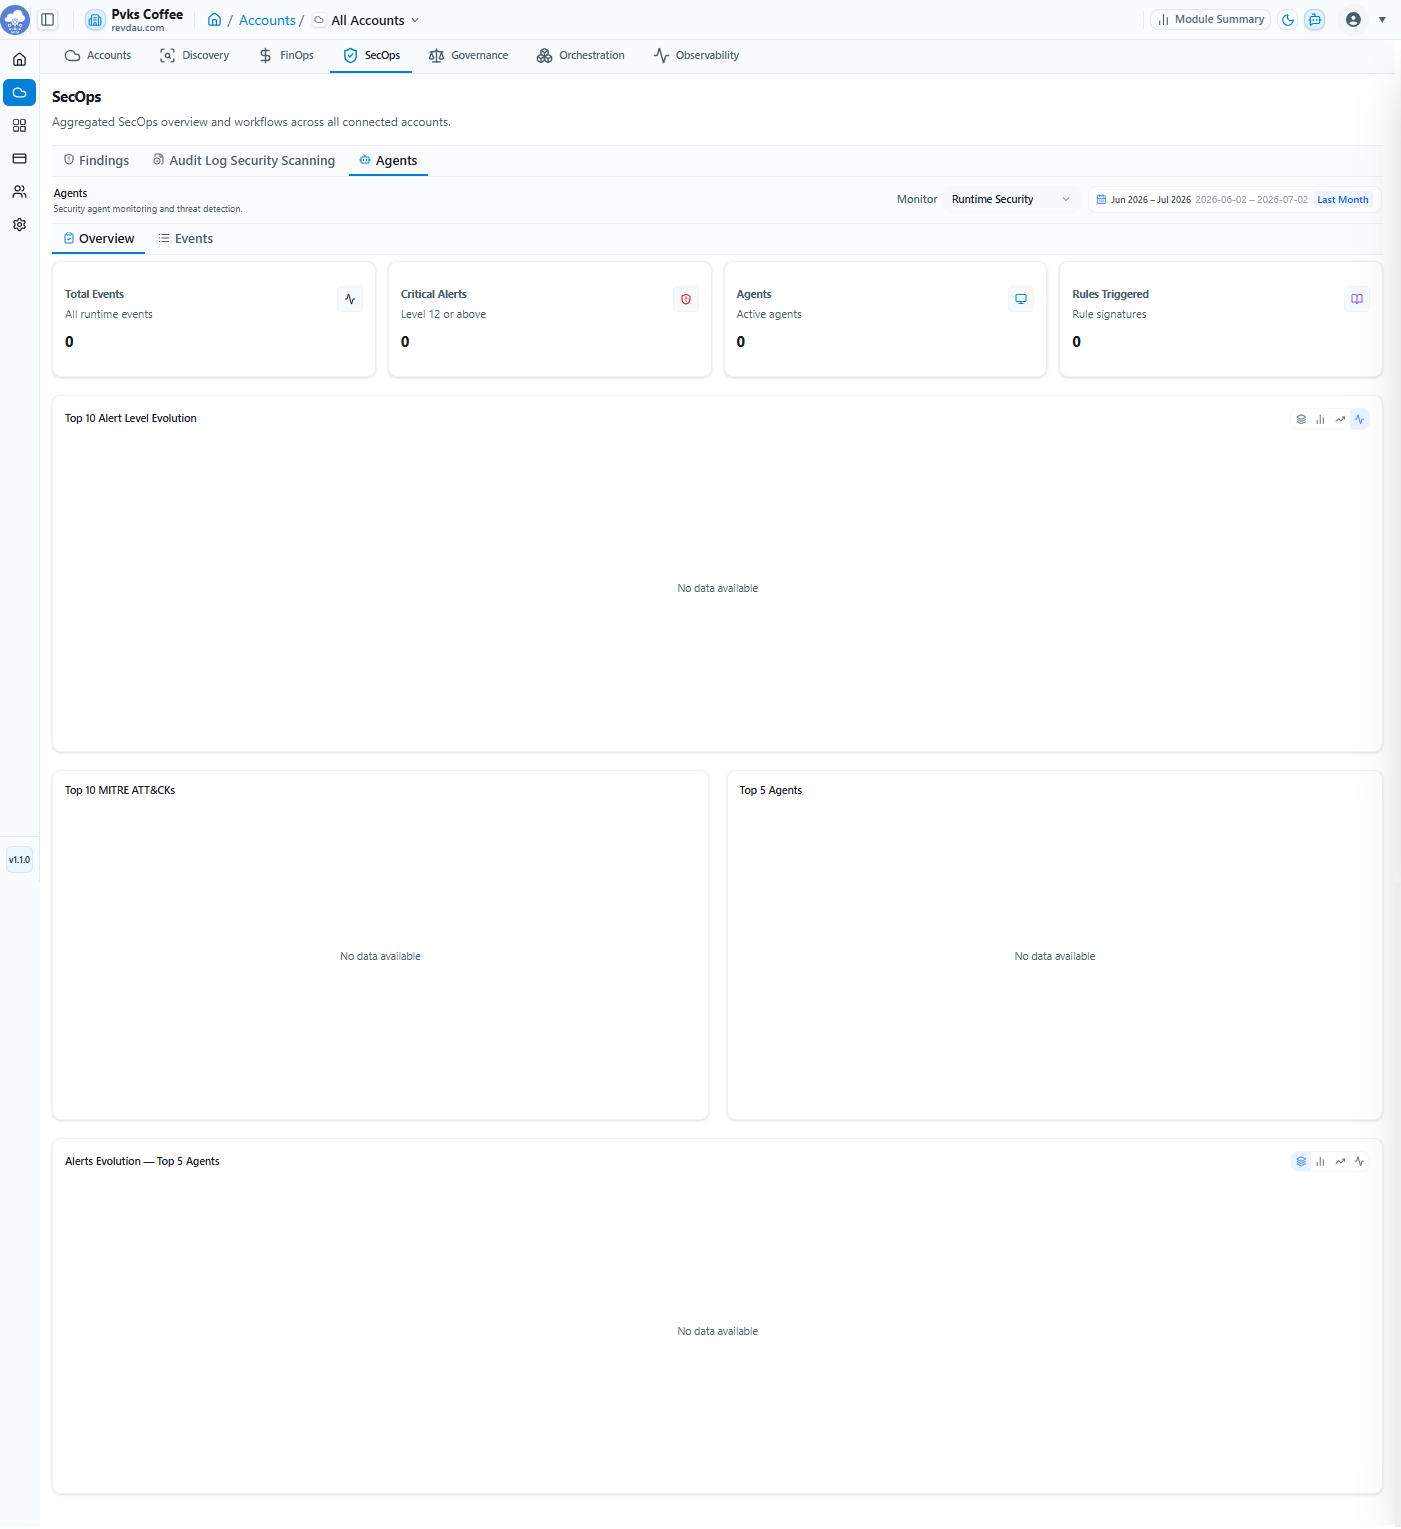
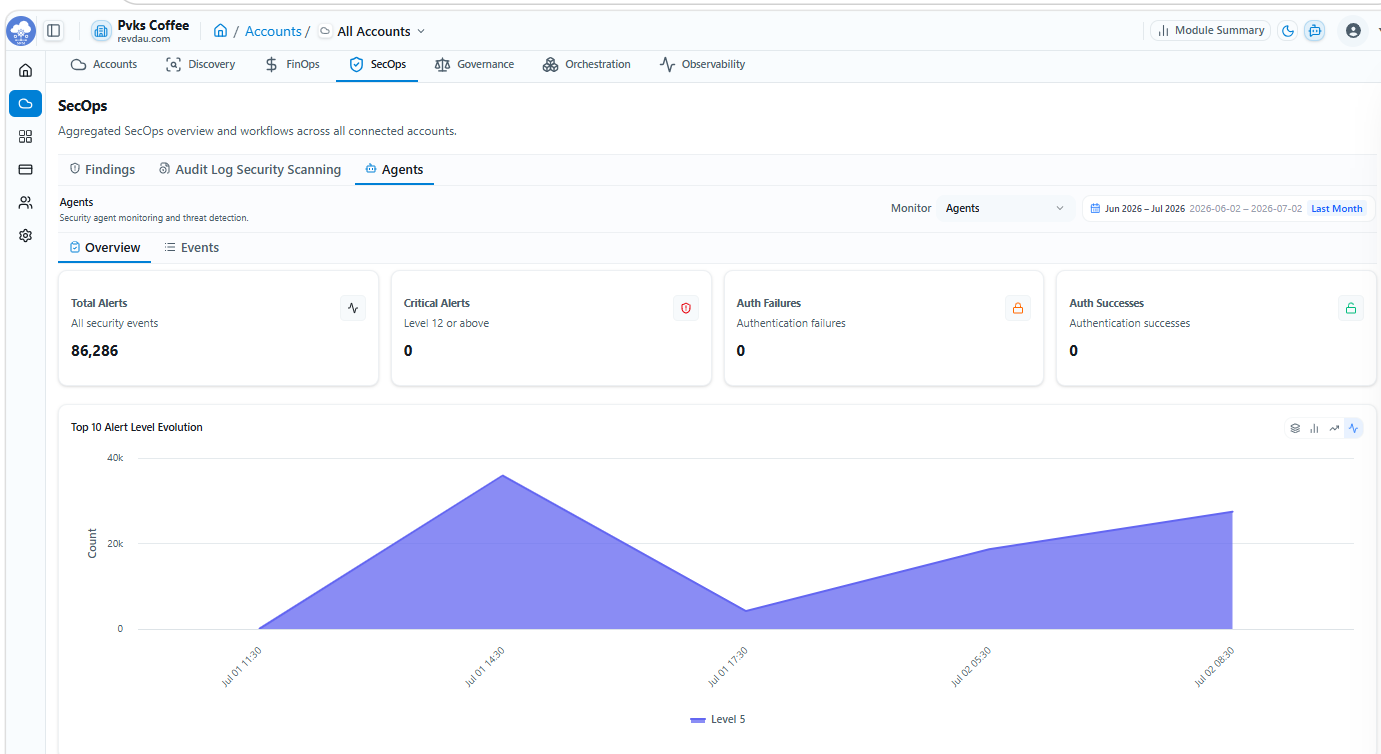
7.6.1 Overview Tab
The cards and charts are the same across monitoring modes — only the values differ depending on the selected mode (Agent, Runtime Security, Network Security).
-
Total Alerts — All security events
-
Critical Alerts — Level 12 or above
-
Auth Failures — Authentication failures
-
Auth Successes — Authentication successes
Three charts are available for data analysis:
-
Top 10 Alert Level Evolution
-
Top 10 MITRE ATT&CKs
-
Top 5 Agents
-
Alerts Evolution — Top 5 Agents
7.6.2 Events Tab
-
Timestamp
-
Agent
-
Rule Description
-
Level
-
Rule ID
-
MITRE Technique
7.7 Trigger SecOps Job
SecOps jobs can be triggered on a schedule or manually. Click the Trigger SecOps Job button to run a manual scan.
7.8 Execution History
Past SecOps scan runs and their results:
-
Execution Time, Status, Duration, Triggered By
-
Resources, Score, Findings, Critical count
7.9 Settings
SecOps module configuration includes:
-
Provider-specific SecOps scanning controls
-
Audit Log Security Scanning — Enable or disable
-
SecOps Module Status — Enable or disable per account