MSP User Guide
v1.1 is unreleased — see v1.0 for the current stable release.
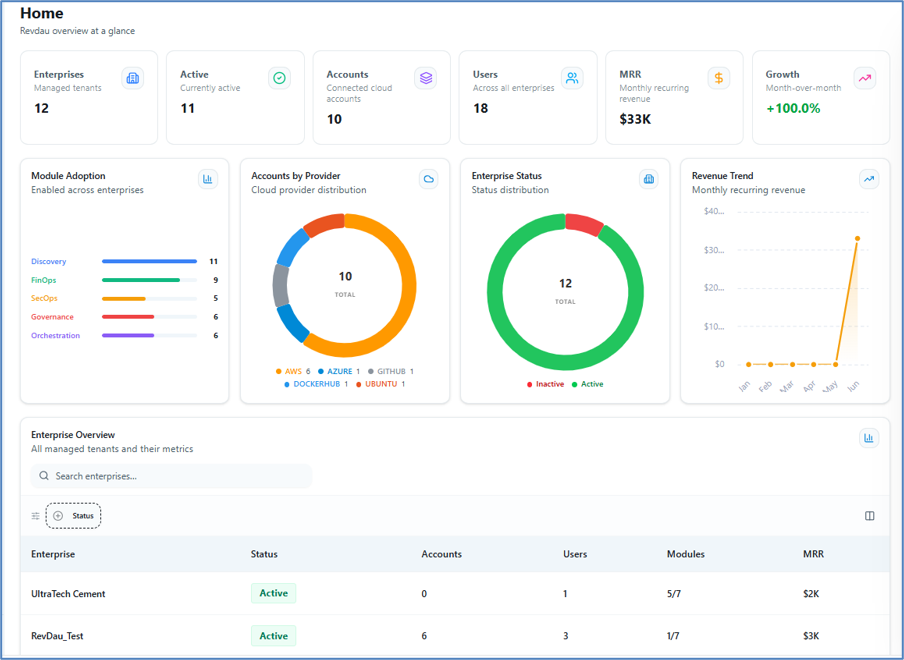
Dashboard (Home)
The Dashboard provides a real-time, executive-level view of your entire multi-cloud environment. Key metrics displayed include:
| Metric | Description |
|---|---|
| Enterprises | Total managed tenants |
| Active Enterprise | Currently active enterprises |
| Accounts | Connected cloud accounts |
| Users | Total users across all enterprises |
| MRR | Monthly Recurring Revenue |
| Growth | Month-over-month growth percentage |
| Module Adoption | Modules enabled across enterprises |
| Accounts by Provider | Cloud provider distribution breakdown |
| Enterprise Status | Active and inactive enterprise status |
| Revenue Trend | Monthly recurring revenue trend chart |
The Enterprise Overview table lists all enterprises with the following attributes:
-
Enterprise Name
-
Status
-
Accounts
-
Users
-
Modules
-
Monthly Recurring Revenue (MRR)
View All Enterprise Overview in such a table view with the following attributes like – Enterprise Name, Status, Account, Users, Modules, Monthly recurring revenue.